Financial market forecasts often use technical analysis, also called charting. Nonetheless, they have decided to disregard the EMH completely. The efficient markets hypothesis (EMH), also known as the random walk theory, states that the present price of an asset is a good indicator of its future worth. As a result, you can’t utilize this information to lose money or outperform the market.
Regarding price forecasting, technical analysis, on the other hand, looks at market volume and behavior rather than the EMH. Technical analysts believe the bull flag price pattern heralds an impending price increase. This article will help you decipher bull flag charts, spot patterns, and their benefits and risks.

What Is Bull Flag Pattern?
One technique used in stock market technical analysis is the bull flag. When a stock’s flag rises, it produces a bull flag pattern. Investors wait for the price to drop before adding to their position or lock in gains during this time, while the firm’s price moves between two levels of support and resistance.
Bull flags are differentiated from ‘M’ patterns—which may indicate a negative double top—by the presence of a ‘W’ pattern within the bull flag. Despite being horizontally oriented, the flag has a downward slope, which means the previous price increase has reversed. Once the countertrend (flag) ends, the upward trend will continue if the price rises over the top of the flag.
Traders anticipate a decline in the stock price when they see a bearish flag instead of a bullish one. A bear flag pattern is characterized by a steep decline in stock prices followed by a period of stability. If you have a Kindle, then you are lucky! I have purchased the “Trading Strategies: Bull Flag Pattern” on Kindle, and I think it is the best thing for trading and identifying bull flag patterns.
Examples Of Bull Flag Pattern
According to the most current market analysis of 2023, technical analysts have seen a bull flag pattern on the Bitcoin price chart, which might suggest a positive setting. During the consolidation stage, the price of Bitcoin forms a flag after experiencing a rapid and sharp spike. According to market experts, the bull flag indicates that the uptrend may take a short break before continuing.
Experts predict that Bitcoin’s value will soon exceed $35,000 due to the bull flag formation. Before jumping into the market, traders can employ additional technical indicators to validate the trend. The price must rise over the flag’s top boundary before long positions may be initiated. Many take this as proof that the rise will continue.
The risks of trading cryptocurrencies are substantial, so you should proceed cautiously even when everything seems to be in order. You must use stop-loss orders and other forms of risk management to safeguard yourself against unanticipated market volatility.
How To Identify Bull Flag Pattern?
To spot the bull flag pattern on price charts, you may utilise the following techniques alongside giving the “Bull Flag Pattern Trading Strategy” a read on the Kindle version for more clarity in thoughts regarding this trading topic for better trades:
Step 1
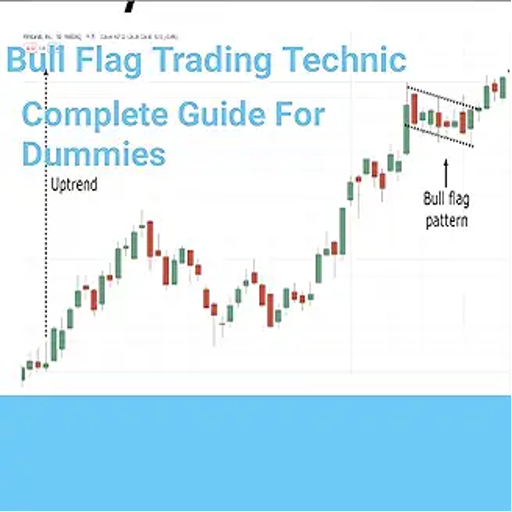
You should know the item’s general trend before searching for the bull flag pattern. You should monitor the trend when prices normally go higher, as during an upswing. The bull flag pattern loses all significance when the asset’s cost is flat or declining.
Step 2
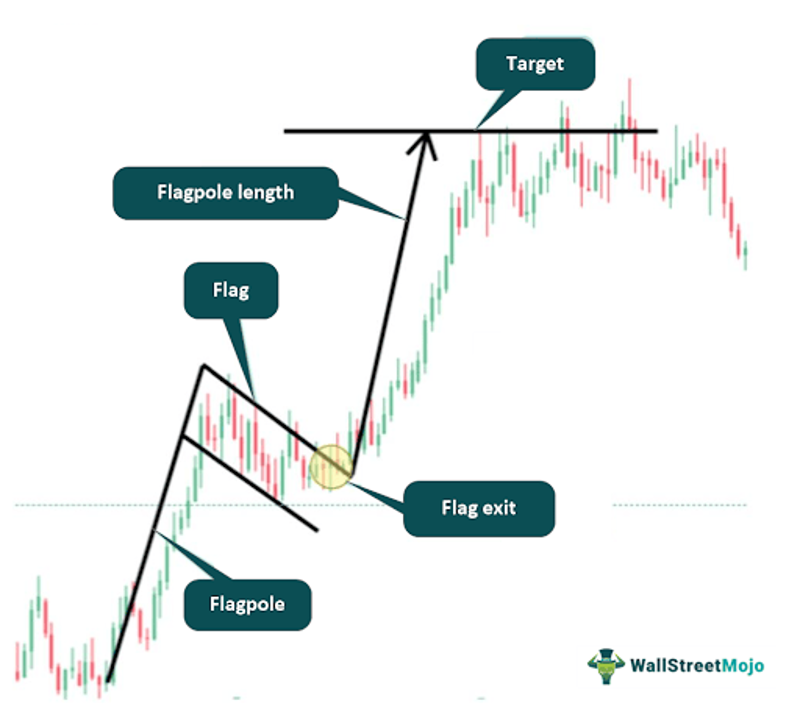
The next step is to find the flagpole, the peak of an uptrend when the price is moving rapidly upwards. The flagpole symbolizes an uptick in purchasing activity.
Step 3
Find the flagpole before you can start drawing a trend line. You can draw a line linking the price action’s low points during consolidation after the flagpole. The lower edge of the flag is readily visible on this trend line.
Step 4
Make a fresh trend line linking the consolidation period’s price peaks. On this trend line, you can see where the flag is at its highest position.
Step 5
If you still need convincing, check the trading volume during market consolidations. In a typical scenario, the flag pattern would fall as it forms, only to rise again during the breakout.
Step 6
After seeing the pattern, try to spot a break above the flag’s upper threshold. A price “flight” occurs when the closing price exceeds the top trend line. When this happens, traders may consider buying positions or going long since the climb will continue.
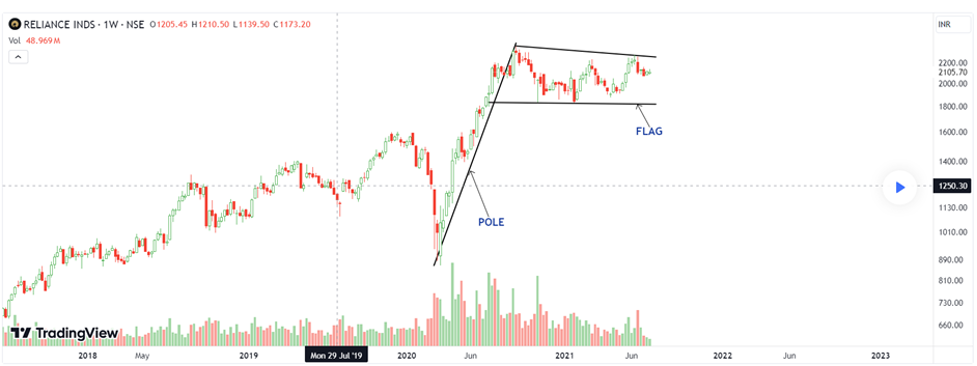
See the Reliance Industries TradingView graphic below to grasp the concept. When the flag’s pole points up, the market should rise. According to the poll, considerable demand and purchase pressure drove the stock price up in recent trading sessions.
After drawing the highs and lows, link the trend lines to create the flag’s upper and lower borders. When the stock’s candlesticks stay narrow, a consolidation phase is likely. The stock price has barely changed. Tracking volume is as crucial as tracking pricing and market change. Every investor should consider volume bars, which boost the stock price.
Thus, most transactions were purchases, driving stock prices up. Poles have substantially less volume than flags. Traders must wait for a break over the top trend line to confirm the move. After that, the parties can agree.
Benefits Of Bull Flag Pattern
The benefits might be hidden, and the majority of the concept of bull flag trades has been unravelled in the book The Anatomy of Bull Flag Trading Strategies, which is available on Amazon, so make sure to read it at all costs.

Clear Points
The bull flag pattern helps traders easily keep track of their assets, showing them where to join and leave a transaction.
Strong Beneficial Potential
As a continuation pattern, the bull flag pattern suggests that the rising trend will resume shortly. Those who stick with it after the breakthrough can reap significant rewards.
Easy Identification
Traders can easily see and trade on the bull flag pattern because of the way price charts display it graphically.
Risks Of Bull Flag Pattern
Fake Breakouts
A false breakout might occur if the bull flag pattern fails to materialize. If the price suddenly exits the flag and then retraces, traders who went long can be surprised.
Whipsaws
Whipsaws and erroneous signals might result from protracted price consolidation within the flag. If traders enter and exit positions too quickly, they risk losing money.
Risk Management
Never trade with money you cannot afford to lose; always use a stop-loss order to restrict your losses. If risk management isn’t right, big losses might happen.